I had to update one of the scripts that monitor our Azure Virtual Desktop environment and realized that it had not been working for newer machines. It didn’t take long to trace this back to an issue with the outdated monitoring agent:
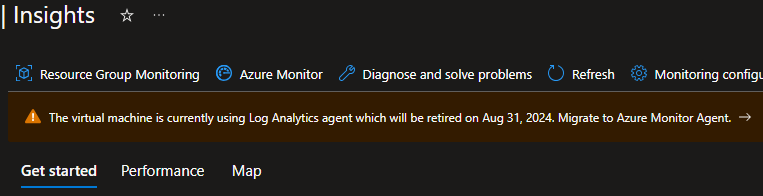
Monitoring had been previously been configured by someone who was no longer available, so I had to figure out how it worked and then get it fixed.
How VM Monitoring Works in Azure #
At a high level, these are the components you need (outlined in the MS Docs):
- The
AzureMonitorWindowsAgentextension needs to be installed on each VM - A Log Analytics Workspace configured for VM Insights
- An identity used to authenticate to the VM Insights Log Analytics Workspace (either System-Assigned or User-Assigned)
- A Data Collection Rule
- (Maybe) A Data Collection Endpoint
The new Azure Monitor Agent is just an extension that is installed on a VM. The extension allows Azure to collect data from the Virtual Machine.
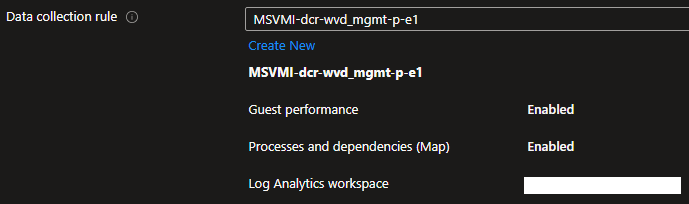
The Data Collection Rule is what the name implies, it’s an object that contains settings for what information should be saved about each VM. These settings are pretty straightforward:
The Log Analytics Workspace stores the collected data. One thing that might be worth mentioning is that under the section for the DCR, the docs state “Only workspaces with VM Insights are listed”. I don’t know what this means and looking at various LAWs within our portal I’m not sure how to differentiate a LAW that has VM Insights enabled compared to one that does not.
Finally, like all things within Azure, you must have some method of authenticating to your service. I always recommend just enabling the System-Assigned Managed Identity on each VM and using that, as opposed to creating a User-Assigned identity.
Migrating to new Azure Monitor Agents #
We already had a LAW that we were using to track data with the legacy agent. So here is the process I used to fix the problem:
- I opened a test VM, went to Settings > Extensions and validated that
AzureMonitorWindowsAgentwas listed (the new Azure Monitor agent) - On the same VM, I went to Monitoring > Insights and clicked on Monitoring Configuration. I did not have a DCR for the new agent, so I used the menu here to create one and assign it to the VM.
- I went back to the extensions menu and removed the legacy
MicrosoftMonitoringAgentextension - I went back to the Monitoring > Insights menu and selected Performance to validate that metric data was still being delivered. (In my case, it was not. See the (Troubleshooting)[#troubleshooting] section below.)
- After troubleshooting, I opened the Data Collection Rule I had created in step 2 and assigned the Data Collection Endpoint under the Resources menu. This may or may not be required for you.
If the agent is working, you should see performance stats listed in under Monitor > Insights on the Performance tab. If it’s not working you see this:
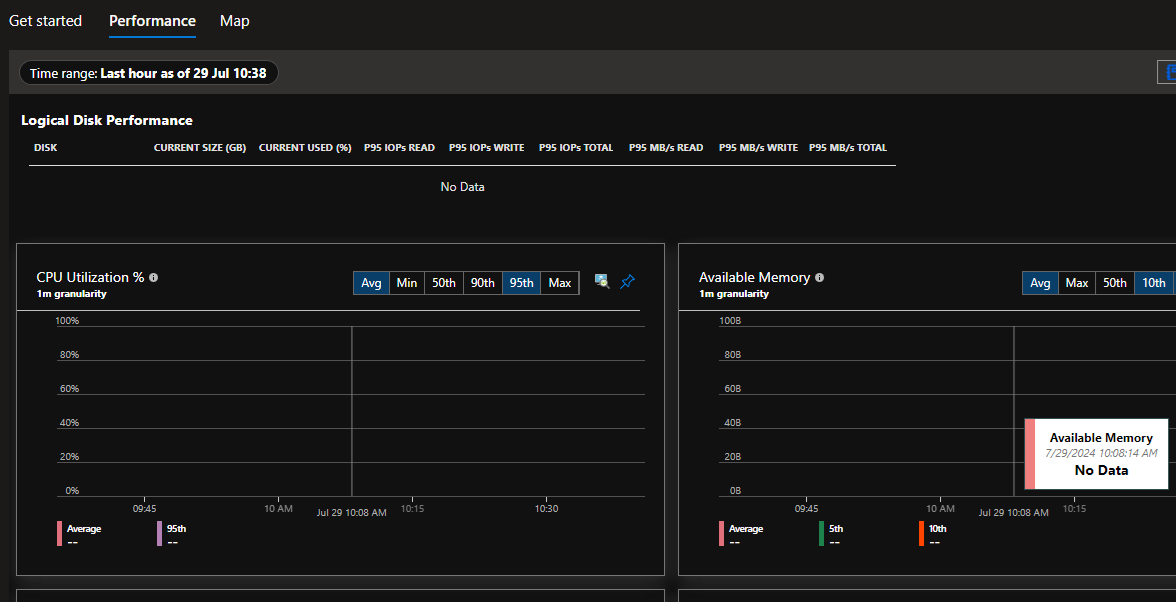
This got the new agent and monitoring data working. I confirmed with a couple other VMs, and then to deploy this for all machines I did the following:
- I made a copy of the Azure Policy Initiative: “Configure Windows machines to run Azure Monitor Agent and associate them to a Data Collection Rule”. This initiative would like work out of the box for most companies if you wanted to assign it, but I needed a few modifications.
- I added policies to configure both the Data Collection Rule and the Data Collection Endpoint, as well as adding the Dependency Agent which allows for the Map feature of VM Insights.
- I deployed the Policy initiative and ran remediation jobs to deploy the agents and associate the DCR/DCE.
- I used the following command to remove the legacy agents:
az vm extension delete --ids $(az resource list --query "[?contains(name, 'MicrosoftMonitoringAgent')].id" -o tsv)
For step 4 above, I was getting a stupid error The command line is too long. so I ended up running the following commands to target a handful of VMs at a time (I only had a small amount so this wasn’t a big deal for me):
$list = az resource list --query "[?contains(name, 'MicrosoftMonitoringAgent')].id" -o tsv
$list.count # Get the total VMs
az vm extension delete --ids $list[0..10] #Targets VMs 1-11
az vm extension delete --ids $list[11..20] # VMs 12-21
# Repeat for all VMs
Troubleshooting #
I ran into two issues as I was trying to figure this out:
- I couldn’t view any log data, I kept getting an access denied error
- The VM wasn’t sending it’s data to the LAW after everything looked like it had been configured correctly
For the first issue, I realized I was getting that error because we are using private endpoints in our environment. For those that don’t know, if you are using private endpoints for Log Analytics Workspaces, you have to create a Monitor Private Link and link it to a Monitor Private Link Scope to interact with any LAWs otherwise you get errors that look like permissions errors. That didn’t take me too long to figure out.
The second issue was trickier. I came across an Azure Monitor Troubleshooting Page that was very helpful.
Based on the instructions from that troubleshooting page, I determined that the VM was not downloading the DCR instructions, so I knew it was a DCR-related issue. This led me to Data Collection Endpoints which I hadn’t needed to use before.
For our environment, the LAW had been created in a separate region from the VMs. Per the Data Collection Endpoint Docs, that’s one of the main reasons a DCE is needed. I created a DCE in the region with the VMs, and then once the VM was associated with both the DCR and the DCE, it was able to start sending data successfully.